Your 2023 mid-season report (for places other than Melbourne)
Nov. 28, 2023
Last week we looked at how things were progressing at the mid-way point of the Victorian grass pollen season in Melbourne and Geelong. This week, we’ll review the season across regional Victoria (and even into southern NSW).
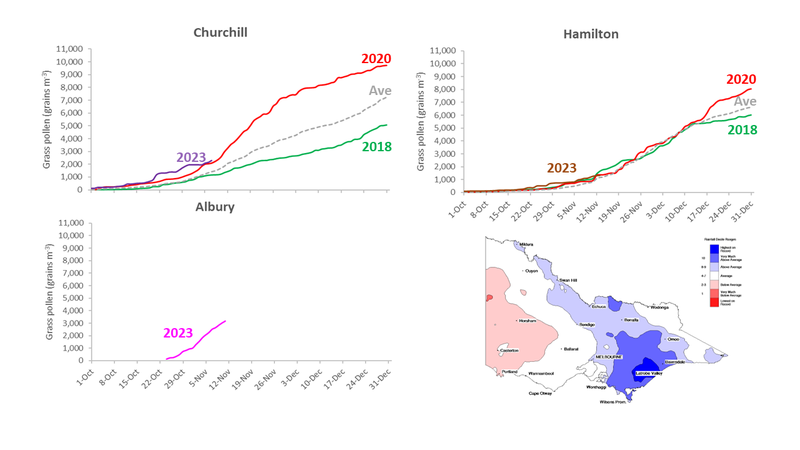
Cumulative grass curves for Churchill, Hamilton and Albury for the 2023 season so far. For the last five years at Churchill and Hamilton (2018-2022), the heaviest (red), lightest (green) and average (grey dash) seasons are shown for comparison. Bottom right shows Victorian rainfall deciles for October 2023 (map image provided by the Australian Bureau of Meteorology).
In last week’s report we used the cumulative grass pollen curves for Melbourne, Burwood and Geelong to track progress of the 2023 grass pollen season.
While Melbourne’s 2023 curve was tracking close to the 5-year average, Burwood’s curve was above the previous heaviest season and Geelong’s curve below the previous lightest season at these two sites since 2018.
That looks like a west-to-east trend, with the grass pollen season getting heavier as you head east. The Country Fire Authority’s map of grassland curing for Victoria supports this trend, with drying of the grasslands (curing) being more evident to the west of Melbourne than to the east.
This week, we’ll extend this by comparing the grass pollen seasons at our most easterly and westerly monitoring sites: the sites in beautiful Hamilton, which is west of the Grampians, and in the equally charming Churchill in the Latrobe Valley.
Like Melbourne and Burwood, Churchill and Hamilton both recorded very early starts to the season with the first day of monitoring, October 1, also being the first high or extreme grass pollen day.
High and extreme grass pollen days are our worst days for hay fever and asthma.
Since then, Churchill has experienced an above average number of high and extreme days (16) while Hamilton’s has had a more typical number of these days (8).
But then, the graph for Hamilton shows that there’s not been much of a difference between the seasons over the last five years, with the cumulative curves for the heaviest, lightest and the average season all lying on top of one another until mid-December when they start to diverge.
Moving to Churchill, so far, the 2023 curve is sitting just above the 2020 curve, which is the heaviest season at this site since 2018.
What’s driving this trend for a heavier season as you move east? As shown in today’s map, this is most likely due to rainfall, particularly the above average rainfall that fell over Gippsland in October.
By helping sustain the growth of pasture grasses, the October rainfall has delayed the onset of grassland curing and resulted in a heavier grass pollen season in the state’s east.
Today’s final graph might not look like much but it’s the first data coming from our new monitoring site in Albury, just across the border in NSW.
Established with the support of the Albury City Council, this site began operating on October 24.
What’s remarkable is that the Albury site has already recorded twice as much grass pollen as Melbourne, even though monitoring started three weeks later.
The Albury site fills the large gap that existed in our monitoring network between Canberra and Dookie and is our first in the Riverina, an area that’s known to experience episodes of thunderstorm asthma.
Forecasts for Albury-Wodonga are available on the Melbourne Pollen app and website.
We’ll update you again in our end-of-year season wrap up or as any new information comes to light.
In the meantime, keep checking the Melbourne Pollen app and website for the latest information.
© 2010- AirHealth Pty Ltd. All rights reserved.
This information is copyrighted (Terms & conditions). Apart from any use as permitted under the Copyright Act 1968, no part may be reproduced by any process without prior written permission. This includes all pollen information and forecasts.