Your 2023 mid-season grass pollen report
Nov. 17, 2023
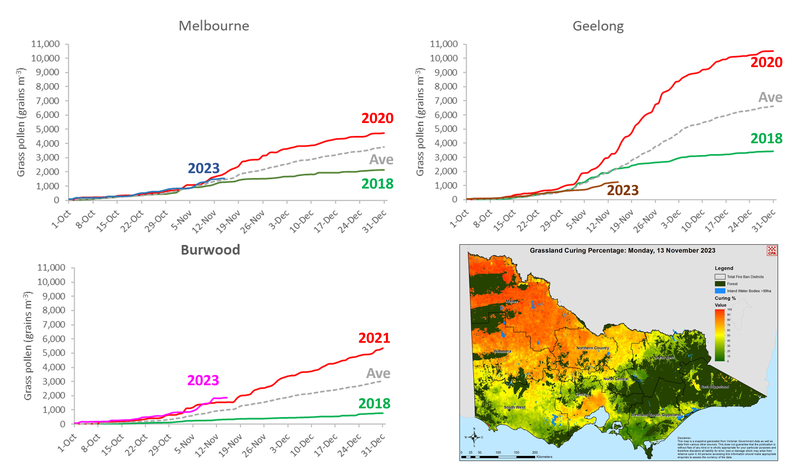
Cumulative grass curves for Melbourne, Geelong and Burwood for the 2023 season up to November 15. For the last five years (2018-2022), the heaviest (red), lightest (green) and average (grey dash) season are shown for comparison. Bottom right shows the Victorian grassland curing map for November 13 (map image provided by the Country Fire Authority).
As we’re at the mid-way point of the Victorian grass pollen season, it’s a good time to let you know how things are progressing. Today we’ll look at Melbourne and Geelong. Next time, we’ll review the season across regional Victoria.
Here at Melbourne Pollen, we measure how much grass pollen is in the air and make a 7-day forecast every day from October 1 through to December 31.
That's 92 days or roughly 14 weeks of counting and forecasting.
In September, we had a look at the season ahead and forecast that, because of an El Niño weather pattern, 2023 would likely see a return to more average grass pollen conditions after the three back-to-back La Niña seasons.
We also suggested that the outlook for a warmer and drier spring might mean both an earlier start to the season and an earlier end as well.
At the Melbourne and Burwood monitoring sites, we did indeed see a very early start to the season with the first high grass pollen day on the first day of monitoring, October 1. This is the earliest day of high grass pollen recorded at either site with records at Melbourne going back to the early 1990s.
Geelong had its first high day on October 21, a date roughly in line with past years.
High and extreme grass pollen days are our worst days for hay fever and asthma.
Since October 1, there has been an above average number of high and extreme days at Burwood and Melbourne – 13 at both sites – whereas Geelong has seen fewer than expected high and extreme days: only 7 so far this season.
Another way of tracking progress of the season is to plot the cumulative grass pollen count, which is the daily sum of all the grass pollen caught in the trap since October 1.
Today's graphs show the cumulative curves for Melbourne, Burwood and Geelong.
For Melbourne, the cumulative curve is tracking close to the 5-year average. At Burwood, the 2023 curve is currently sitting just above the 2021 curve, which is the heaviest season at this site since 2018.
By contrast, the Geelong curve is currently sitting well below the 2018 curve, which is the lightest of the past five seasons at this site.
While all three curves are rising, at some point the curves will flatten as the grass pollen season comes to an end. This coincides with grasses starting to dry off, a process known as curing.
Today’s map from the Country Fire Authority shows grassland curing for Victoria. The CFA uses this information to assess the likelihood of grassfires.
The map shows that the curing of Victoria’s grasslands is already underway, particularly in the north-west of the state but also across areas to the west of Melbourne. Curing is not as evident across Gippsland in the state’s east.
This degree of curing points to an early end of the season in Melbourne and Geelong with the last high or extreme day at these site maybe happening this side of Christmas. Hopefully, that means we can stop worrying about the grass pollen season and start enjoying the Festive Season.
But while the end may be in sight, the season isn’t over yet as we’re expecting to see several high and extreme days over the next ten days.
We’ll update you again in our end-of-year season wrap up or as any new information comes to light, and next week look at what’s happening with grass pollen elsewhere around the state.
In the meantime, keep checking the Melbourne Pollen app and website for the latest information.
© 2010- AirHealth Pty Ltd. All rights reserved.
This information is copyrighted (Terms & conditions). Apart from any use as permitted under the Copyright Act 1968, no part may be reproduced by any process without prior written permission. This includes all pollen information and forecasts.