
Your symptom reports are helping us advance hay fever science
Oct. 5, 2026
When you record your symptoms in the app, you share something a pollen monitor cannot measure: your experience.
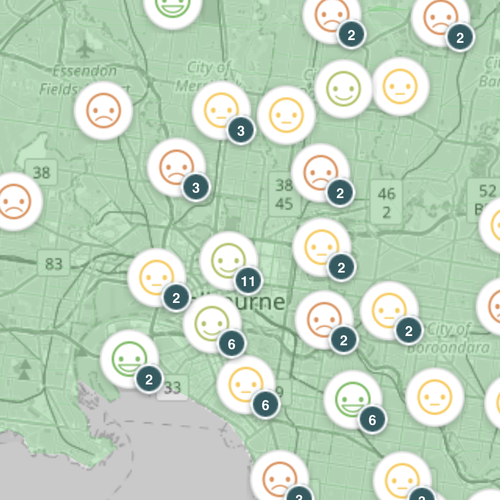
Whether you are struggling with hay fever, noticing a few mild symptoms or feeling completely well, those observations matter. Together, they help researchers connect what is in the air with what people are experiencing.
Now, nearly 115,000 symptom reports from more than 25,000 of our users have contributed to a new scientific study, revealing important patterns in when symptoms occur, which airborne exposures are associated with them, and how those patterns differ between groups of people.
Published in GeoHealth, the research brings together AirHealth’s Dr Edwin Lampugnani and researchers at the University of Queensland. It draws on reports contributed by our community across seven grass pollen seasons, from 2017 to 2023.
- “This research shows what our community and our services can achieve together,” says study co-author Dr Edwin Lampugnani.
- “Pollen monitoring tells us what is in the air. Your symptom reports help us understand what people are experiencing. Bringing those two things together gives us a much richer picture of hay fever and helps us build on the information our services provide.”
Connecting your experiences with the environment
The researchers compared symptom reports with measured grass pollen concentrations, other airborne pollens, weather and air pollution data. They examined how symptom reporting changed with environmental conditions, both on the day of exposure and in the days that followed.
This approach captures experiences that hospital records alone cannot show. Many people manage their hay fever at home, even when symptoms are disruptive. App-based reporting helps make those everyday experiences visible to researchers.
Your reports helped the team investigate several important questions: How closely do symptoms follow changes in grass pollen? How long does the association last? What else in the air might matter? And how do these patterns differ between groups of people?
What your reports helped researchers discover
Grass pollen was most strongly linked with symptoms on the same day
As grass pollen concentrations increased, hay fever symptom reporting generally increased too. The strongest association was on the day of exposure, with a weaker association the following day.
- “Overall, symptoms were strongest on the day of exposure and generally less severe the next day,” said senior author Associate Professor Nicholas Osborne from University of Queensland’s School of Public Health.
By sharing how they felt across different days and conditions, app users helped researchers understand not just the connection between grass pollen and hay fever, but also its timing.
Personal sensitivity matters, including at lower pollen levels
The reports also helped researchers examine what happens at lower grass pollen concentrations.
- “We found measurable increases in symptoms for some people on days when grass pollen levels were classified as low,” said lead author Max Tyler, an epidemiologist and UQ PhD candidate.
Pollen categories describe concentrations in the air. In the classification used in this study, “low” included small amounts of grass pollen, not only days when none was detected. The analysis found increased symptom reporting at concentrations still within that category.
This adds useful context to pollen information. Alongside knowing the expected conditions, understanding your own symptom patterns may help you recognise when those conditions are relevant to you. It is also one reason the researchers see value in developing more personalised approaches.
Other pollens and air pollution were part of the picture
Grass pollen was an important part of the findings, but it was not the whole picture.
- “Other airborne pollens and fine particle air pollution were also associated with reported symptoms,” Max said.
The study found that higher concentrations of non-grass pollen and fine particle pollution, known as PM2.5, were associated with increased hay fever symptom reporting. PM2.5 refers to very small airborne particles measured as air pollution.
For the community, this highlights the value of considering the wider environmental picture. Grass pollen information remains an important part of understanding exposure, while information about other pollens and air quality can add further context.
Building on the value of your pollen forecast
Your symptom reports are helping us explore an important question: how can we make pollen information more useful to you as an individual?
The differences observed in this study support further research into more personalised approaches, building on existing forecasts with a better understanding of people’s sensitivity and symptom patterns.
- “Personalised forecasting is central to our vision at AirHealth,” says Dr Lampugnani.
- “Our pollen forecasts help people prepare for the conditions ahead. We want to build on that by bringing together pollen and air quality information with a person’s allergy history and symptom patterns, to help estimate their individual symptom risk.
- “The aim is to help answer a very practical question: ‘What might these conditions mean for me?’ That additional context could help people plan their day and manage their exposure with greater confidence.
- “Your symptom reports are an essential part of working towards that goal. They help us connect environmental conditions with people’s experiences, building the evidence we need to make our services increasingly useful and personal.”
This study contributes to that evidence. The researchers also noted that earlier work using AirRater symptom reports in Tasmania found similar patterns in the timing of symptoms associated with grass pollen. Contributions from different communities are helping strengthen our understanding of the relationship between airborne pollen and everyday symptoms.
What Thank you for helping make this research possible
Every time you tell us how you’re feeling, you share a small part of your day with us. Whether you’re struggling with symptoms or feeling well, we appreciate you taking that moment.
To everyone whose reports contributed to this study: you helped make this research possible. Your experiences have helped us understand more about when hay fever symptoms occur and how they relate to what is in the air. We’re delighted to share these findings with you, because they are something you helped us achieve.
Whether you’ve been sharing your experiences for years or have only just started, thank you for being part of our community. Please keep telling us how you feel, on the good days as well as the difficult ones.
We’re listening, we’re learning, and we’re grateful for your help.


© 2010- AirHealth Pty Ltd. All rights reserved.
This information is copyrighted (Terms & conditions). Apart from any use as permitted under the Copyright Act 1968, no part may be reproduced by any process without prior written permission. This includes all pollen information and forecasts.